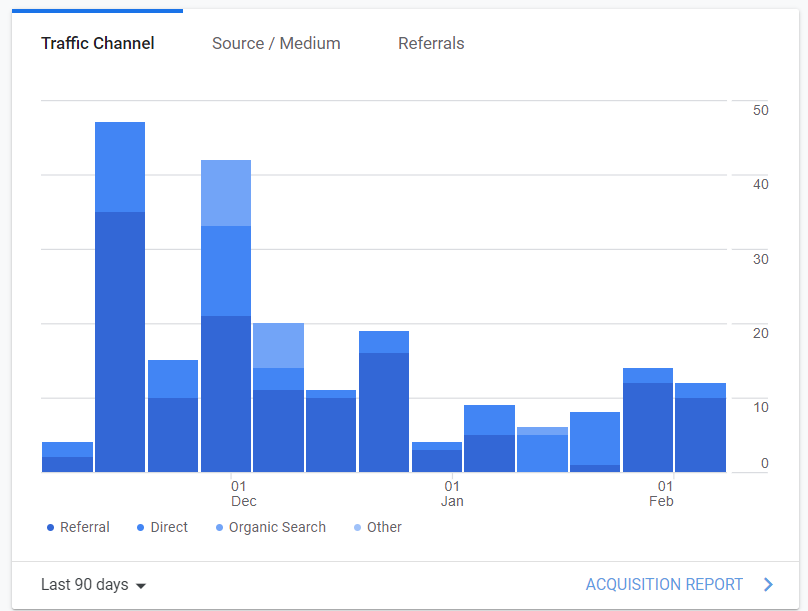
Looking at pas 90 days of Shinyappsio consumption to inform 2023 renewal.
Author
Ran Li
Published
February 6, 2023
Executive take-aways
High consumption for bchc_covid19 app
We are still seeing quite a bit of traffic here (see supplemntal figure below)
But consumption is driven primarily by some residual settings that were not turned off.
We removed the 24/7 on-time but…
I forgot there were some app settings tweaked for persistence that was causing high consumption. e.g. Instance Idle Timeout Time after which your idle application will be stopped. The min is 15 minutes but it was set to 60 minutes.
We set all settings to default… so we should expect much lower consumption from this app
Overall consumption is ~500 hours per month
Taking into account the projected decrease in bchc_covid19, we expect much less than 500 hours per month of usage with our current apps
A basic plan ($440/year) with 500 hours per month would cover our needs.
See below for supporting materials.
Plots
Quick EDA on ShinyAppsio usage to inform plan renewal for 2023. We’ll look at by app daily vs monthly consumption as well as account level monthly consumption.
Note that in highcharted you can click the legend to remove or add back specific lines. or exmaple you can click bchc_covid19 to remove it and rescale the plot.
Code
df_usage_daily %>%hchart("line",hcaes(x = date, y = hours, group = app)) %>%hc_title(text ='Daily trends over last 90 days by app')
Code
df_useage_monthly %>%filter(month !="2") %>%hchart("line",hcaes(x = date, y = hours, group = app)) %>%hc_title(text ='Monthly trends over last 90 days by app') %>%hc_subtitle(text ='Monthly cumulative hours used is displayed at the midpoint of each month. ')
Overall
Code
df_usage_monthly_overall %>%arrange(date) %>%hchart("line",hcaes(x = date, y = hours)) %>%hc_title(text ='Overall usage over 3 months') %>%hc_subtitle(text ='Monthly cumulative hours used is displayed at the midpoint of each month.') %>%hc_yAxis(min =0)
Supplemental figures
Source Code
---author: Ran Lidate: "02/06/2023"title: "Shinyappsio Usage and projected needs"description: "Looking at pas 90 days of Shinyappsio consumption to inform 2023 renewal."categories: - Shinyformat: html: toc: true toc-location: left df-print: paged code-fold: true code-tools: trueexecute: warning: falseeditor_options: chunk_output_type: console---## Executive take-aways- High consumption for `bchc_covid19` app - We are still seeing quite a bit of traffic here (see supplemntal figure below) - But consumption is driven primarily by some residual settings that were not turned off. - We removed the 24/7 on-time but... - I forgot there were some app settings tweaked for persistence that was causing high consumption. e.g. `Instance Idle Timeout` Time after which your idle application will be stopped. The min is 15 minutes but it was set to 60 minutes. - We set all settings to default... so we should expect much lower consumption from this app- Overall consumption is ~500 hours per month- Taking into account the projected decrease in `bchc_covid19`, we expect much less than 500 hours per month of usage with our current apps- **A basic plan ($440/year) with 500 hours per month would cover our projected 2023 needs.**See below for supporting materials.## PlotsQuick EDA on ShinyAppsio usage to inform plan renewal for 2023. We'll look at by app daily vs monthly consumption as well as account level monthly consumption.Lets first pull in some usage data!```{r}## Dependencieslibrary(rsconnect)library(tidyverse)library(purrr)library(lubridate)library(highcharter)## Get App namesapps =applications(account ="drexel-uhc",server="shinyapps.io") %>%as_tibble() %>%select(id, name) %>%mutate(id =as.character(id))### Pull Datastart_date ="2022-10-03"end_date =Sys.Date()api_result = rsconnect::accountUsage(account ="drexel-uhc",server="shinyapps.io",usageType ="hours",from = start_date,until = end_date,interval ="1d").x = api_result$points[[1]]list_result = api_result$points %>%map( ~{ hours_tmp =map(.x,2)%>%unlist() tibble(date =seq(ymd(start_date),ymd(end_date)-1,by ="day") ) %>%mutate(day =row_number()) %>%mutate(hours = hours_tmp) }) df_result =map2_df(list_result,names(list_result),~{.x %>%mutate(id_chr = .y)}) %>%mutate(id =str_remove(id_chr,"application-")) %>%left_join(apps) %>%select(name, date, day, hours) %>%arrange(name,date) #%>% # group_by(name) %>% # group_modify(~.x %>% mutate(hours_cum = cumsum(hours))) %>% # ungroup() %>%# mutate(month = month) %>% # select(month, everything())df_usage_daily = df_result %>%filter(!is.na(name)) %>%rename(app = name) %>%mutate(month =month(date),year =year(date)) %>%arrange(app, year, month)df_useage_monthly = df_usage_daily %>%filter(month !="2") %>%group_by(app, month, year) %>%summarise(hours =sum(hours)) %>%ungroup()%>%arrange(app, year, month) %>%mutate(date =ymd(paste0(year,"/",month,'/15')))df_usage_monthly_overall = df_usage_daily %>%filter(month !="2") %>%group_by(month, year) %>%summarize(hours =sum(hours)) %>%mutate(date =ymd(paste0(year,"/",month,'/15')))```### By appNote that in highcharted you can click the legend to remove or add back specific lines. or exmaple you can click `bchc_covid19` to remove it and rescale the plot.```{r}df_usage_daily %>%hchart("line",hcaes(x = date, y = hours, group = app)) %>%hc_title(text ='Daily trends over last 90 days by app')``````{r}df_useage_monthly %>%filter(month !="2") %>%hchart("line",hcaes(x = date, y = hours, group = app)) %>%hc_title(text ='Monthly trends over last 90 days by app') %>%hc_subtitle(text ='Monthly cumulative hours used is displayed at the midpoint of each month. ')```### Overall```{r}df_usage_monthly_overall %>%arrange(date) %>%hchart("line",hcaes(x = date, y = hours)) %>%hc_title(text ='Overall usage over 3 months') %>%hc_subtitle(text ='Monthly cumulative hours used is displayed at the midpoint of each month.') %>%hc_yAxis(min =0)```# Supplemental figures